L01
Driven by time
Six nodes. Already moving.
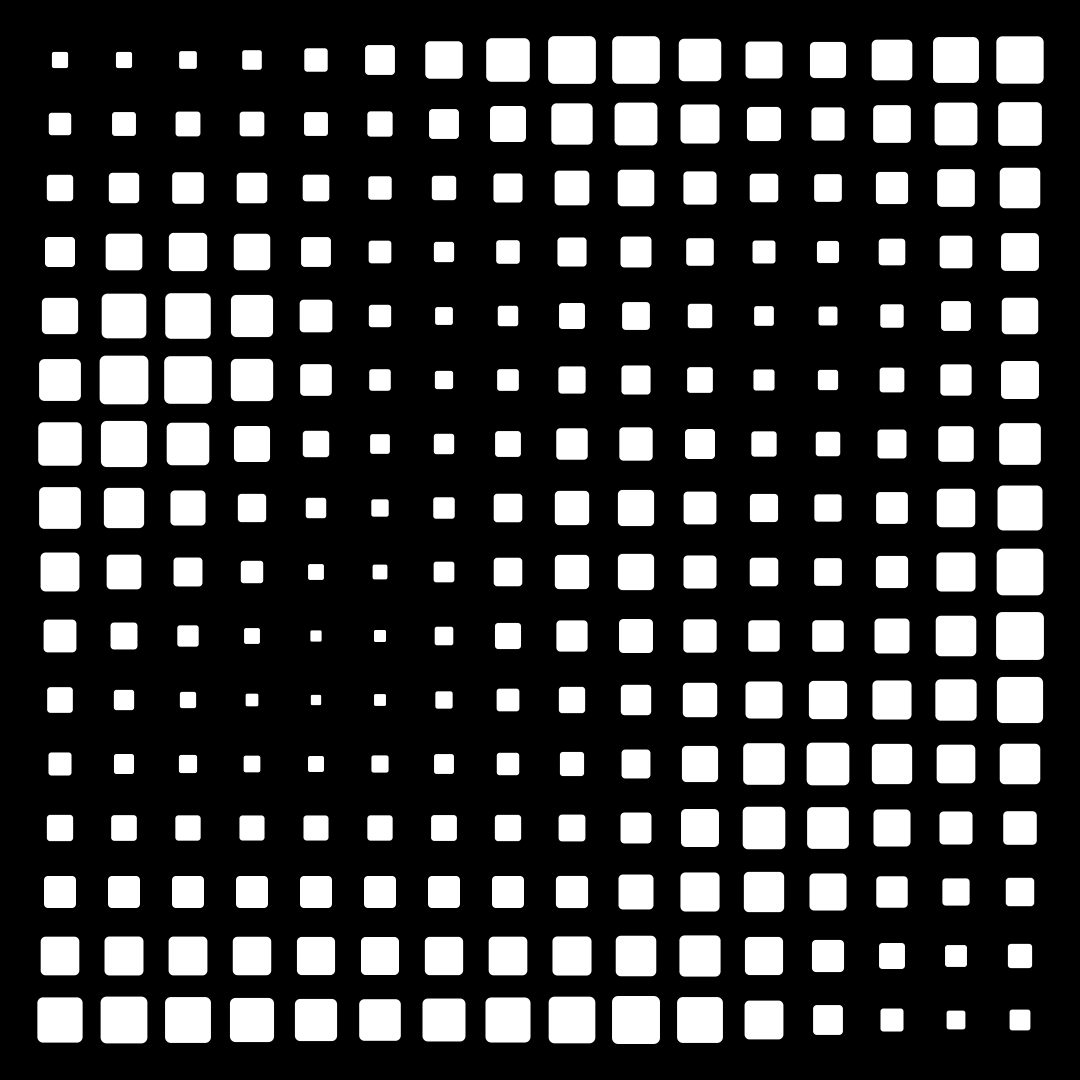
A grid of 16 × 16 rounded squares, each with its own size and movement. A simple introduction to nodes, connections and the way a graph turns logic into form.
Seven small experiments. Seven ideas to explore, from your first nodes to formulas, live inputs and parametric design. Every example is a real, editable QubeGraphix graph. The .qx files are included with the beta.
A grid of 16 × 16 rounded squares, each with its own size and movement. A simple introduction to nodes, connections and the way a graph turns logic into form.
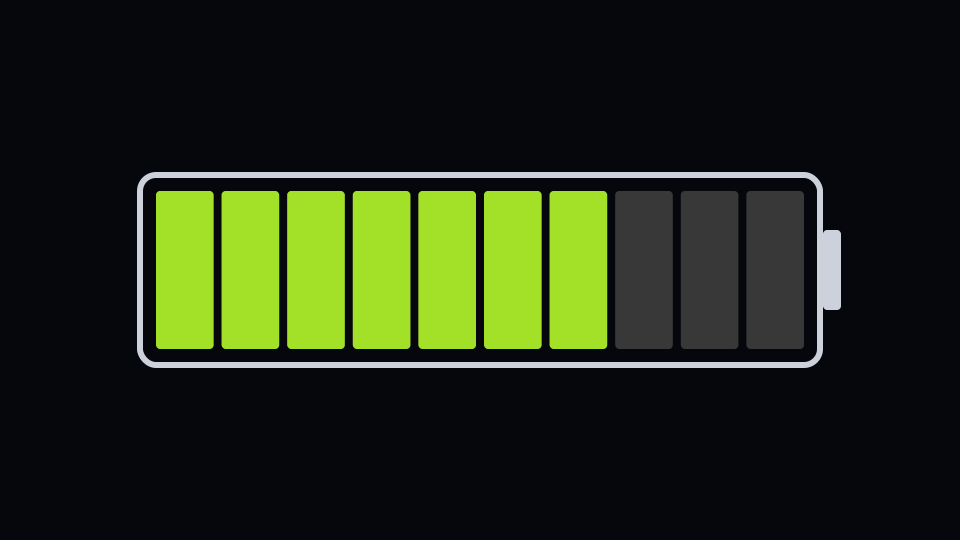
A battery indicator built from a repeated shape, a Cell Mask and a colour ramp. Change one value and watch the segments light up: a simple example of how data becomes visual information.
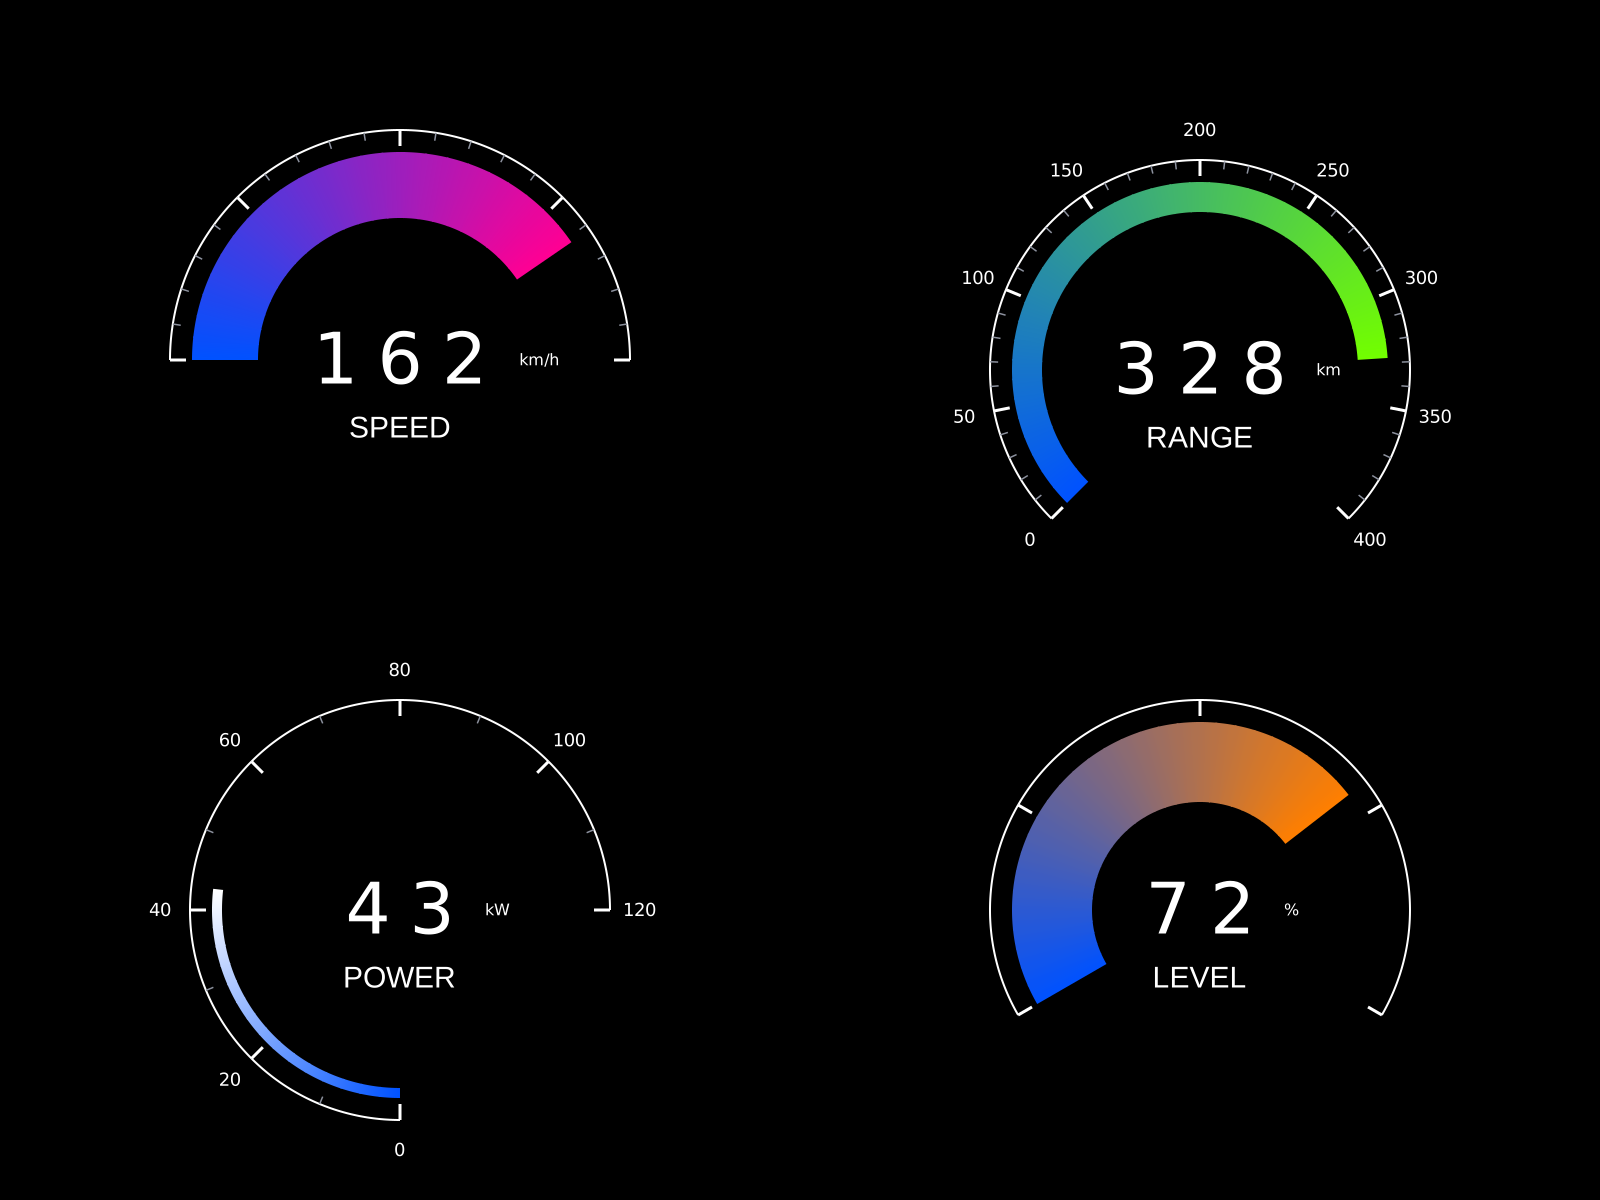
One parametric dial, four different identities. Change its range, proportions, colours, scale and divisions to create instruments for different purposes, without rebuilding the graphic.
A 3D geometric tunnel shaped by noise and perspective. Connect your phone to the same network and use its browser as a live controller, with no extra app required.
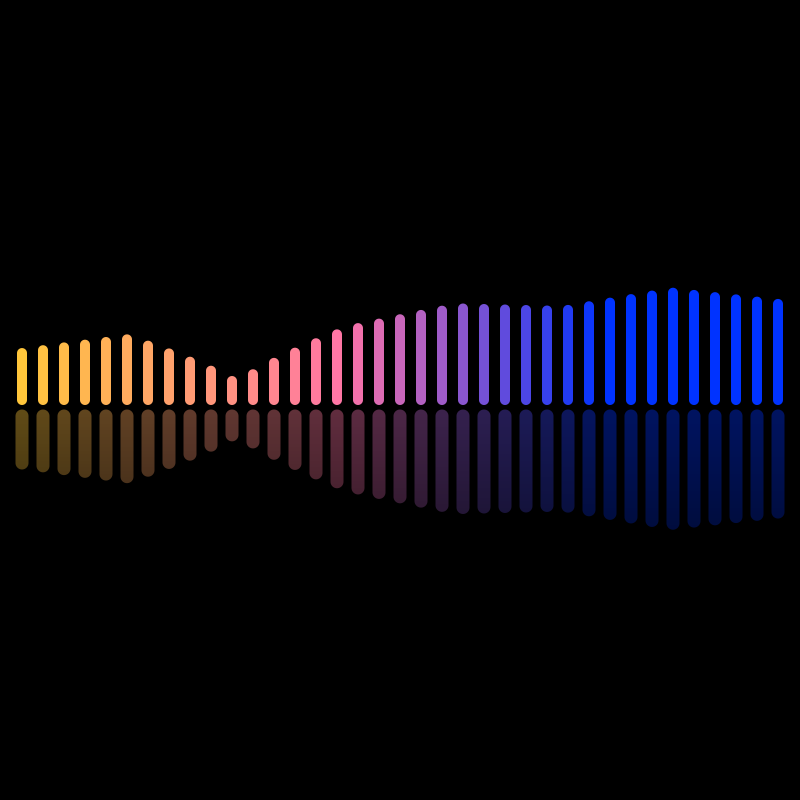
Thirty-seven bars respond to your microphone or computer audio. Each frequency becomes movement, height and colour, turning sound into a live visual composition.
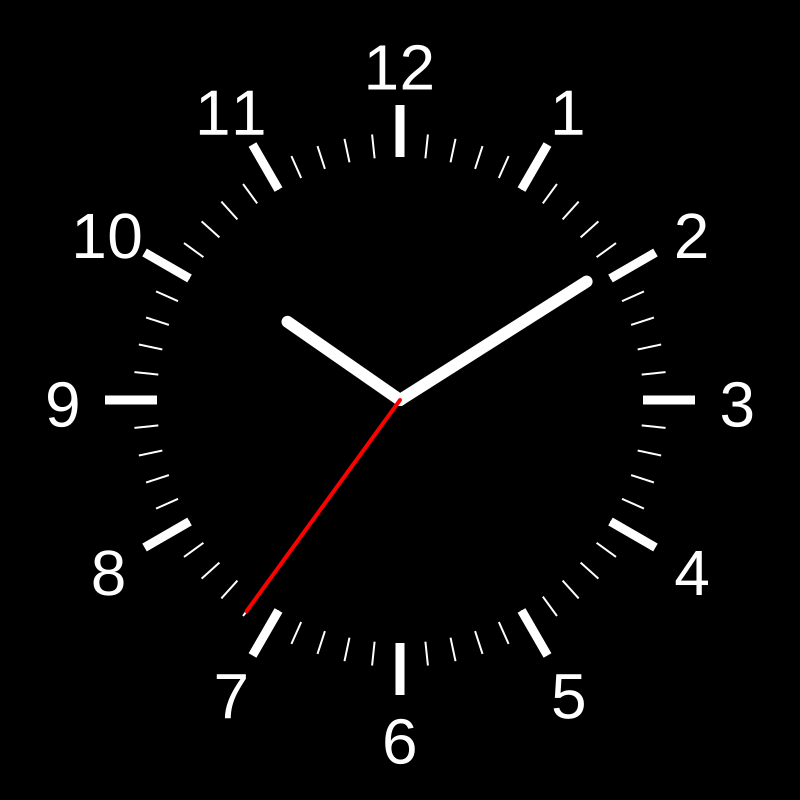
A working clock, driven by the computer's actual time. The DateTime node supplies the values; the graph turns them into moving hands. A simple starting point for time-based interfaces and displays.
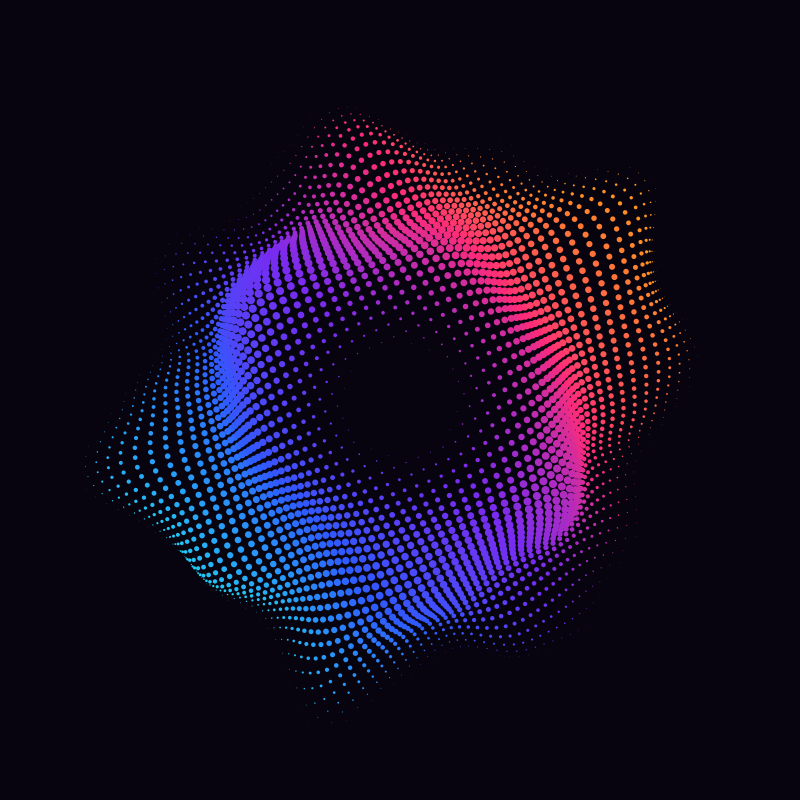
A 70 × 70 grid becomes a moving, folded surface. One Formula combines three measurements to control the shape: an introduction to creating more complex behaviour from a few lines of logic.
See what happens when these building blocks become complete projects.
Explore Projects →The official QubeGraphix skill for Claude can turn a description into an editable .qx graph. You decide what to make; Claude creates the starting point.
The result is not a fixed image or a black box. It's an ordinary graph you can understand and keep developing.
The skill is included with the beta.
The beta is by invitation, and I read every application myself. Tell me what you'd like to create: the Editor and the editable example files come with access.
Is there an idea you'd like to see as an example? Suggest it: write to info@qubegraphix.com and tell me what you'd like to learn next.